| Breaking Story (3/13/18): The Financial Times has a story which mirrors the major points of our following blog article -- Go Here. |

| Key Background Points for Today's Blog: In discussing U.S. foreign oil dependency, two measures are used: |
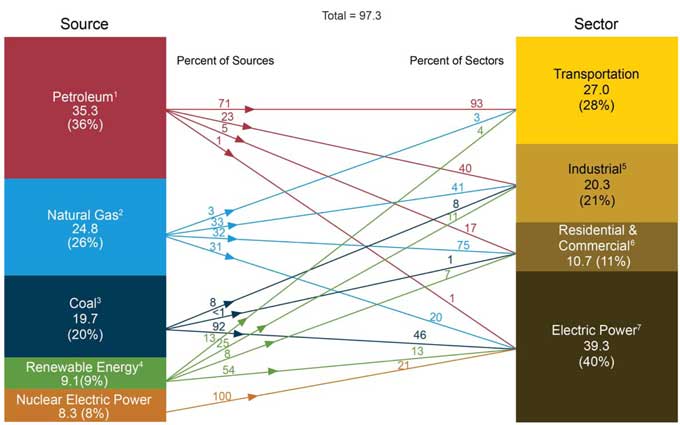
What does Energy Independence even mean? In a context of U.S. foreign energy independence, it is oil and only oil that's relevant.
Oil remains the dominant fuel used in the U.S., accounting for ~37% of total energy consumption in 2015. Oil is consumed mostly within the transportation sector, with very little used for electricity generation (~1%).

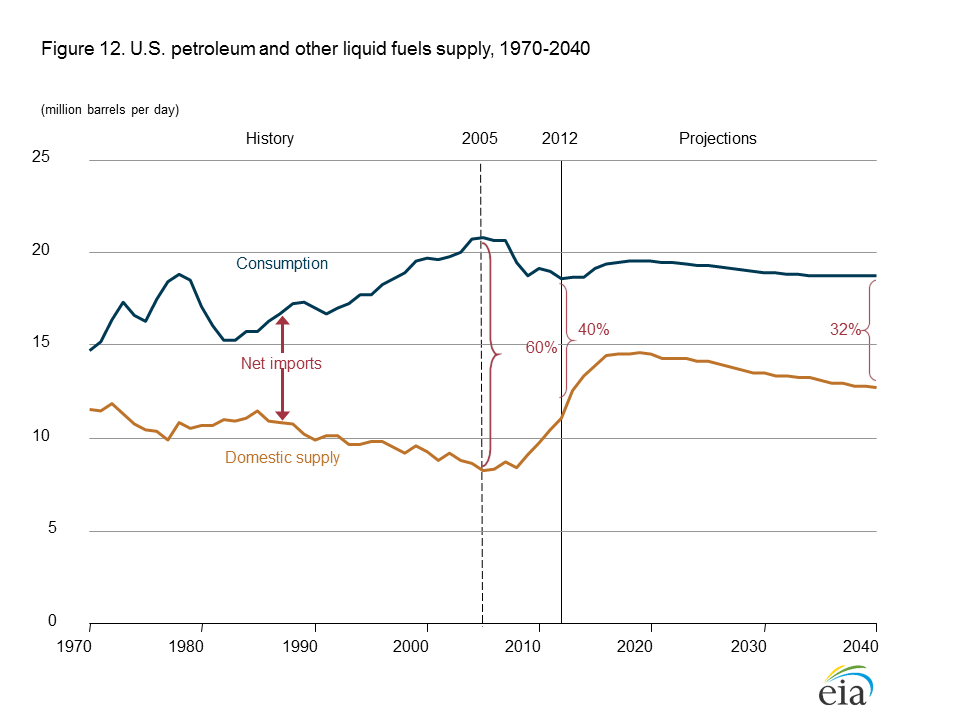
But only citing net imports does't tell a whole story. Of the total petroleum used in the U.S. in 2015:

~9.4 MMb/d ; exported ~4.8 MMb/d; with resulting net imports of 4.6 MMb/d.
In using Net Imports as the most commonly cited metric, an assumption is thus inferred that Exports must reduce the foreign dependency of Gross Imports. Today, we will explore whether this is an appropriate assumption.
Gross Versus Net: The significance between gross versus net imports is a relatively recent development. For decades prior to the current boom in domestic oil production, yearly U.S. exports were very constant at ~5% of total petroleum used. However, during the past 9 years (breakthroughs in fracking, horizontal drilling), two things have dramatically changed:
- Field production of oil/other petroleum liquids has more than doubled.2
- Petroleum exports have increased by 5 times.3 (2) From 5.5 million barrels per day (2006) to 12.6 million bpd (Feb. 2016).
(3) Primary U.S. petroleum exports are diesel, gasoline, and natural gas liquids.

| Gross Imports: | |||
| Exports | |||
| Net Imports |
Looking at the above numbers, one might "conclude" that the U.S. is now just importing more crude, refining it, and then exporting the end-use products of this foreign oil (gasoline, diesel) -- with a "net" of zero.
| But the Import/Export paradigm (model) just isn't this simple due to: |
- Configuration/Design of many U.S. Refineries to use heavy oil.
- U.S. Refineries using financial arbitrage to gain competitive advantages in high value World Gasoline/Diesel Markets.
Foreign Sources of Oil: This metric can also be misleading. While it is emphasized that Canada is the "single" largest foreign country supplier to the U.S. (2.81 million bpd) -- OPEC countries import a comparable amount of oil (2.65 million bpd).4
(2015)

Oil Production & Consumption:
| So with the U.S. oil boom, why are we still importing so much foreign oil? The answer is found in the fact that not all crude oil is the same. It can have a density ranging from heavy to light, sour (high sulfur content) or sweet; priced internationally (Brent) or priced domestically (West Texas Intermediate). |
Type of Oil: In 2015, ~90% of imported crude oil was heavier, with a gravity below 35 degrees API. At the same time, more than 70% of the crude oil produced in the Lower 48 states was light oil or condensate with an API gravity above 35 degrees.
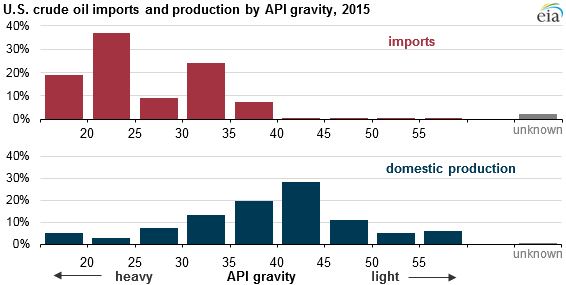
| However, note that imports of foreign heavy crudes have increased. |

This is because products like gasoline which sell at a significant premium to other products (e.g., residual fuel oil) can be more easily and cheaply produced using lighter, sweeter crude oil in simpler refineries.5

Pricing Benchmarks for Oil: West Texas Intermediate (WTI) is a benchmark at which oils produced in the U.S. trade. Internationally, about two-thirds of all crude contracts reference a Brent benchmark. For various reasons, internationally priced oil (Brent) has traded at a premium to domestic priced crudes (WTI) for the past decade6.
| Stated another way, domestic U.S. oil has been trading at a discount from Internationally priced Brent Oil. |

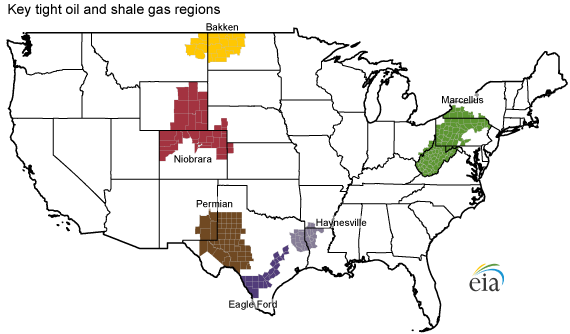
What the Heck Is Going On? With the exceptional increase in U.S. oil production from tight shale formations/fracking (e.g., North Dakota, Texas, etc.) there is good and bad news:
- Most of this oil is high quality light crude, relatively easy to refine in refineries that are not terribly complex.
- However, many U.S. refineries can not use this lighter oil.

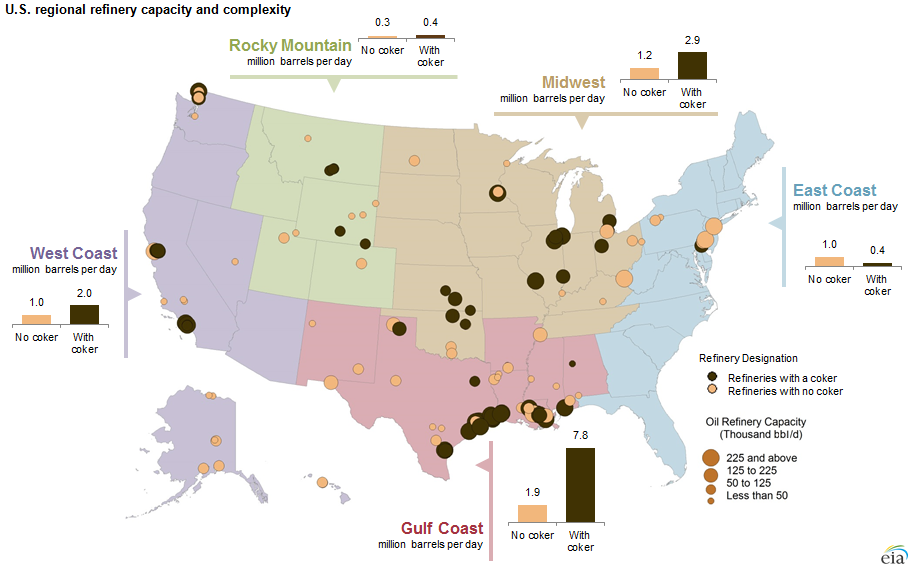
As a result of this infrastructure investment, the U.S. now has more complex Refineries than anywhere else in the world -- as shown in the below graphic which includes the Nelson Complexity Index:
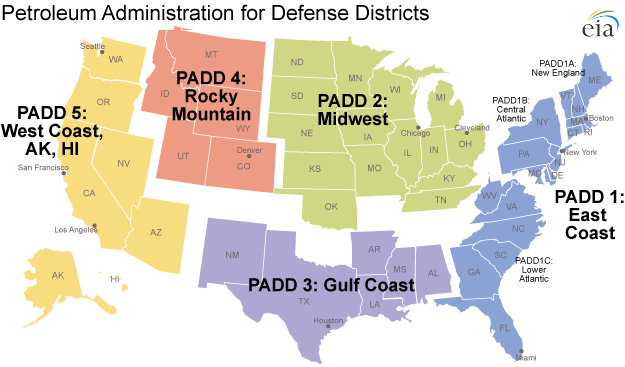
 Understanding the U.S. regional (called PADDs) composition of refineries ranging from simpler to complex (catalytic crackers, reformers, cokers) help explain the type of oils primarily used within each region.8
(8) Recognizing that higher and lower API oils are always blended for specific Refineries to optimize production.
| For example, Refineries in PADD 1 (East Coast) are generally not terribly complex and thus will use more lighter oils. In PADD 3 (Gulf Coast), 81% of Refineries have coking capacity -- explaining their use of more heavier oils. |
 |
Production | Crude Used in Refineries9 |
|
| PADD 1 | ||
| PADD 2 | ||
| PADD 3 | ||
| PADD 4 | ||
| PADD 5 | ||
| Total |
The overwhelming majority of Canadian oil goes to PADD 2. Most of the Middle East imports are received in PADD 3 (e.g., Saudi Arabia owned Motiva Refineries). Heavy crude imports from Mexico and Venezuela also primarily go to PADD 3 (e.g., Venezuela's CITGO Refineries). The majority of African oil is consumed in PADD 1.
(9) U.S. Department of Energy Report, pages 15, 26.
Arbitrage: But historically, there's been more to understanding U.S. imports and exports other than just Refinery configuration -- something called arbitrage.
| Oil Arbitrage: The practice of U.S. Refineries buying lower cost U.S. light oil (pegged to WTI), refining it, and exporting/selling gasoline to World markets that mostly used higher cost oil (pegged to Brent). |
Gasoline is an international commodity. A U.S. refiner could as easily sell their product to the international market if that would maximize their profit. According to the U.S. Department of Energy study, "Brent crude oil prices are more important than WTI crude oil prices as a determinant of U.S. gasoline prices".10
Thus, U.S. Refineries have had two highly significant market advantages in selling high-end products to both the U.S. and World markets (gasoline to Mexico & South America; diesel to Europe):
- Financial Arbitrage on lighter oils.
- Ability to use lower cost heavier crudes in complex Refineries.
(10) US refining flexibility sustains export opportunities, profitability.


(1) Process Domestic lighter crudes into gasoline and diesel fuel for export;
(2) Import heavier foreign crudes for Domestic consumption:

decrease U.S. foreign dependency on heavy crude imports from Saudi Arabia.
Thus in using Net Imports as a dependency metric, it would be important to know its composition. Remember, the basic tenent in using Net Imports is that somehow, Exports decrease U.S. Gross Imports dependency.11
(11) Gross Imports of 49% minus Exports of 25% equals Net Imports of 24%.
Incredibly though, not even the Energy Information Administration (EIA) can answer this question:
| "We cannot determine the exact amount of crude oil produced in the United States that is consumed, as refined products, in the U.S." |
In using EIA data though, we can at least frame the "How Much" question of foreign oil dependency -- where of the total Petroleum Consumed, about 50/50 came from Imports and Domestic Production, with 25% Exported:

Scenario 1: ALL domestic oil is consumed within the U.S.
Scenario 2: ALL imported oil is consumed within the U.S.
| Petroleum in the U.S.: | Use of Imports | Use of Imports |
| Total Processed | Exported | |
| Consumed Only in U.S. | ||
| Produced & Used Only in U.S. | ||
| Imported & Used Only in U.S. | ||
| Foreign Dependency |
Potential Actions: Regardless of what "metric" that one believes is appropriate -- Donald Trump is correct in elevating foreign oil dependence as an important issue in this Presidential election:
While the old GOP mantra of "Drill Baby Drill" and eliminating environmental regulations will assuredly be a Trump meme, will he show depth and breath on this issue? The following are some items that could be proposed:
Refinery Tax Credits: As discussed, a major cause of foreign oil dependency is the configuration of U.S. Refineries to use heavy oil. Without incentives, Refineries are not going to simply walk away from their sunk investment and spend money to reconfigure yet again to primarily light oils. Federal incentives could be an investment tax credit (similar to solar energy) and/or accelerated tax depreciation (e.g., a one year write-off).
Oil Production Tax Credit: Another Federal incentive could be a tax credit (similar to yearly credits given to wind and nuclear) for the domestic production (per barrel) of heavy crudes. The U.S. has vast undeveloped resources of heavy oil in the Alaska North Slope.
Repeal Jones Act on Oil Transportation ; Shipping between U.S. ports costs significantly more than international voyages. This is largely because of a ~100-year-old federal law (Jones Act) which requires domestic cargoes to travel on U.S.built, owned and crewed vessels. A qualifying U.S. tanker currently commands rates from 3 to 4 times more than a non U.S. tanker of the same size.12,13
The Jones Act explains how importing oil from half way around the world (Middle East OPEC countries of Saudi Arabia, Iraq, etc.) can be cheaper than transporting oil via tanker from the U.S. Gulf Coast area to East and West Coast markets.
Tariffs on Imported Oil: While very much of a long-shot, an oil tariff could get political support from two unlikely bedfellows: the domestic oil industry and the renewable energy industry. The domestic oil industry would love a tariff because it protects the industry from the competition of cheaper OPEC oil imports. Saudi Arabia's current price suppression strategy specifically targets the high-cost hydraulic fracturing or fracking in deep shale deposits that has been largely responsible for the rise in U.S. oil production.
The renewable energy industry might well join the oil industry in supporting such a tariff because a high oil price makes alternatives to oil more attractive.14
Final Thoughts: When Foreign Oil Dependency is discussed, a metric stated in percentages can lose some of its impact as to a "big picture". The below graphic puts foreign oil dependency in a clearer perspective of dollars. Even using "Net Imports", the trade impact is a whopping deficit/negative $123 billion per year ($246.5 less 62.7 less 60.7).

Additional Resources:
US refining flexibility sustains export opportunities, profitability (excellent)
Why are U.S. Oil Imports increasing in 2017?
Gas Glut in U.S. and Europe -- Bloomberg
Is Russia Influencing Trump’s Thoughts on Energy? (Texas Monthly)
Summary: Effects of Removing Restrictions on U.S. Crude Oil Exports
The myth of US self-sufficiency in crude oil -- Energy Matters Blog.
Who is Buying U.S. Crude Oil? (Bloomberg)
1st quarter 2016 Refiner Profits Decrease
Oil Rich Venezuela Imports U.S. Crude Oil
IEA warns of ever-growing reliance on Middle Eastern oil supplies
When U.S. President Eisenhauer Restricted Imported Oil
Trump is Wrong on Trade Agreements (Wall St. Journal)
Energy Information Agency (EIA) Analysis:
Effects of Removing Restrictions on U.S. Crude Oil Exports
U.S. Crude Oil Production Forecast Analysis of Crude Types
What Drives U.S. Gasoline Prices
U.S. Crude Oil Production to 2025: Updated Projection of Crude Types
Energy Information Agency Data:


